Monthly Investor Letter, May 2022

Companies Are Cautious Despite IT Spending Not Deteriorating Yet

After a choppy first-quarter earnings season in April where many consumer-facing companies disappointed, citing macro uncertainty, investors worried that the weakness would spill over, causing the broader IT spending to slow down in the coming months. Over the past few weeks, many off-cycle companies with April quarter-end reported. In general, we have not seen a broad-based demand slowdown just yet.

For semiconductor and hardware companies, demand looks very healthy, and the more significant challenge for them is still the supply chain disruption. Nvidia's data center business continued its strong performance with no signs of deceleration. Broadcom and Marvell delivered upside surprises thanks to solid momentum in the data center and networking business, and so did Dell. The only weaknesses we've seen are Cisco and HPE, but both cited supply chain issues without any demand shortfall. Given the broad exposure of these companies, it is unlikely for all of them to not see any signs of weakness if demand is indeed falling off.

In enterprise software, the message is a bit more mixed. While there were signs of slowing down for some “good to have but less mission-critical” software like Workday, most enterprise software vendors still delivered solid results, with security spending most resilient. Microsoft's recent guidance adjustment is another data point. Despite lowering June quarter revenue by 1%, the difference is entirely driven by a bigger than expected currency impact. With only one month remaining in the quarter, Microsoft is effectively telling everyone that the core business is trending precisely as expected, refuting the concern around IT spending deterioration for now.

However, the worry is unlikely to go away soon, with the Fed on a mission to cool off the economy to fight inflation. Case in point, management teams' mention of "macro uncertainty" has skyrocketed lately, and the list of companies with hiring freezes or layoffs is growing longer. We will likely get stuck between the “worry of a sharp slowdown” and “result of continued strength” in the coming months.


Earnings Revision Is a Lagging Sign for Market Turns, as Always

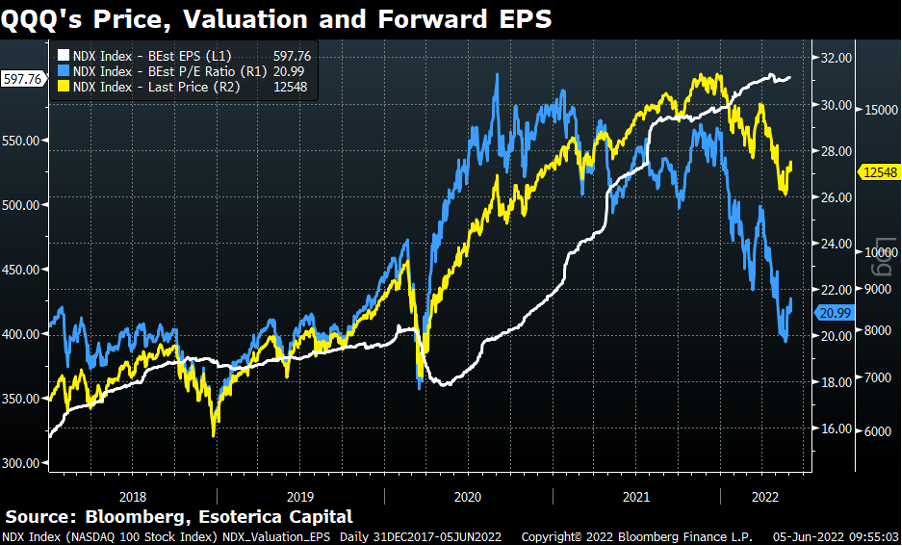
At its worst, QQQ’s ongoing drawdown reached 29% during the month, entirely attributable to the contraction of multiples (Blue line, Chart 1). The forward earnings have held up surprisingly well (White line, Chart 1). There is a growing narrative that the market won’t see its bottom until the earnings are revised down significantly: investors are still hopelessly optimistic about a ‘softish landing’ from the earnings’ perspective. However, history doesn’t seem to endorse this view. In the previous two episodes of market corrections (Q4’2018 and March 2020) in Chart 1, the forward earnings only started to come off when the market had almost hit bottom. By the time the forward earnings bottomed, the market had already recovered most of the drawdown. The earnings revision is a lagging indicator for timing the market corrections and subsequent recoveries.

Chart 1

article
QQQ's Price, Valuation and Forward EPS

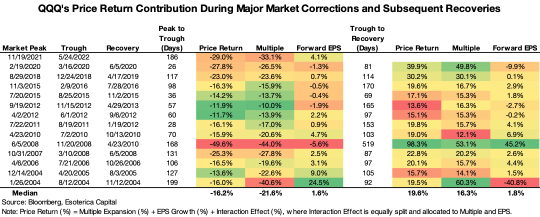
We summarized QQQ’s price return contributions amid major corrections (>10%) and subsequent recoveries since 2004 (Chart 2). The historical evidence supports our hypothesis: it’s primarily up to multiples to put down the market and then bring it back. The earnings revisions did very little during the course.

Chart 2

article
QQQ's Price Return Contribution During Major Market Corrections and Subsequent Recoveries

This exercise reminds our readers and ourselves that the market itself is a leading indicator, and it moves way ahead of fundamentals.


The Fed’s Neutral Rate Problem Continues

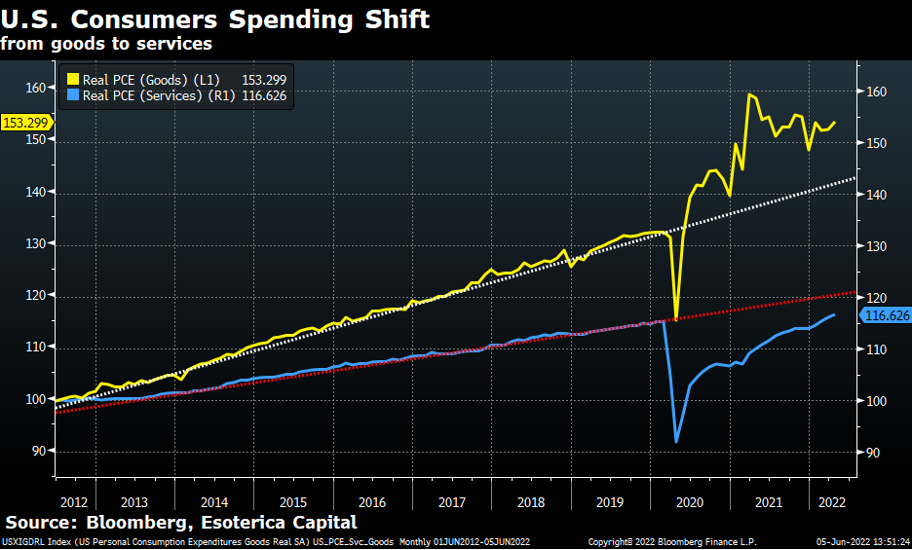
We argued that the Fed has a neutral rate problem in the previous letter, which continued into May and is likely to drive monetary policies and risky assets until inflation shows consistent signs of being under control. We are still miles away from it despite inflation coming down gradually in the past months. It’s just not fast enough. The U.S. economy turned out to be much more overheated than expected. Take real personal consumption (adjusted for inflation, Chart 3), for example, the U.S. consumer spending on goods remained way above the trend line after months into the Fed’s tightening. At the same time, spending on services has also caught up significantly. It remains an open question if the Fed needs to be more aggressive. Is the Fed going to offer new insights into the neutral rate in the June FOMC meeting with a higher longer-run dot? By how much? These updates could potentially move risky assets in a big way.

Chart 3

article
U.S. Consumers Spending Shift

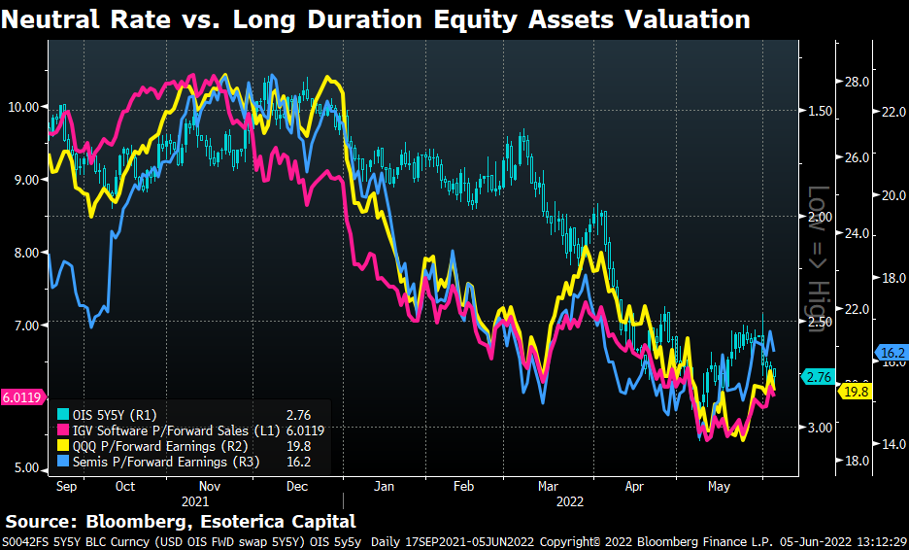
It’s no surprise that the neutral rate has been more closely dictating the ups and downs of equities since April (Chart 4). Major markets of interest to us (Semi, Software, etc.) seem to be fairly priced now.

Chart 4

article
Neutral Rate vs. Long Duration Equity Assets Valuation

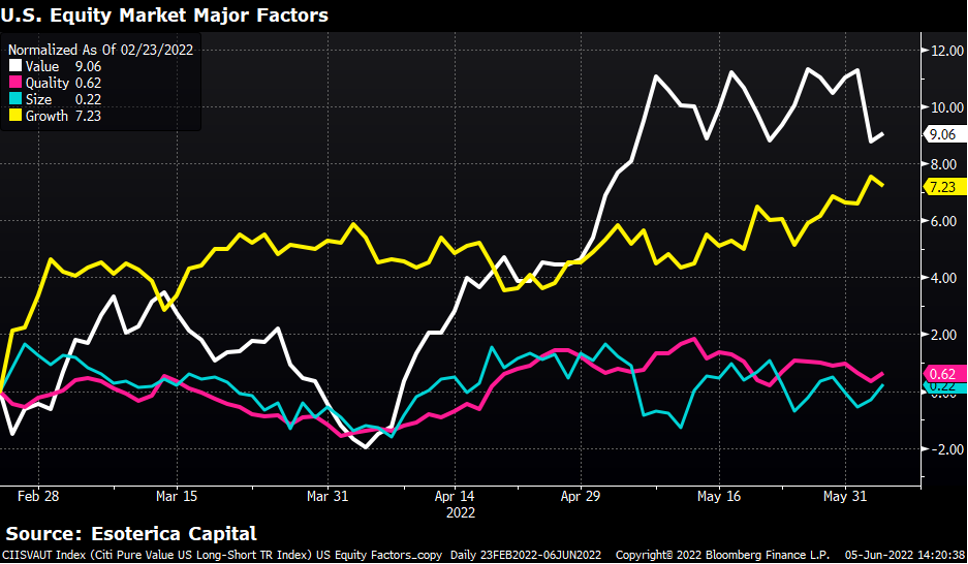
Investors Favor Growth, Dislike High Prices

We prefer analyzing equities from the factors’ perspective since it gives us consistent and cleaner insights into the thinking of markets. To our surprise, at first sight, the growth factor has been performing quite well since bottomed in February (Yellow line, Chart 5). Only slightly behind the value factor (White line, Chart 5), which has been the obvious winner when the real yield is running higher.

These price actions indeed make a lot of sense. It’s easier to comprehend the outperformance of the value factor, which is the equity market’s answer to the roaring inflation. When the recession concerns emerged in May, the outperformance of the growth factor started to accelerate. While growth becomes scarce, investors become more willing to pay for it. We believe these two themes (inflation and recession) will continue to dominate the market narratives in the near term. Play along.

We close this month’s letter with a quote from the most hawkish FOMC committee member, James Bullard. He surprised us with his comment on “the end of 2019 longer-term rates” being the benchmark after inflation comes under control. It might be premature to think about it now seriously, but it’s bullish for risky assets, especially long-duration ones if it turns out to be true.

Chart 5

article
U.S. Equity Market Major Factors

“Before the pandemic, at the end of 2019…, longer-term rates were moderate, with the 10-year Treasury yield at 1.86% and the 30-year fixed-rate mortgage at 3.96%. This may provide a practical benchmark for where the constellation of rates may settle once inflation comes under control in the U.S.”

-- James Bullard, President of the Federal Reserve Bank of St. Louis,

The First Steps toward Disinflation, Presented at Economic Club of Memphis, June 1st, 2022

LETTERS

Esoterica's statements are not an endorsement of any company or a recommendation to buy, sell or hold any security. For full disclosures, click here.

Get the most lucid takes on where things are headed

Articles and educational writing for smarter investing.

How to Build a Three-Fund Portfolio

Asset Allocation for Diversification

How to Measure Economic Cycles

What Is GDP
What Is GDP
What Is GDP
What Is GDP
What Is GDP
What Is GDP
What Is GDP
What Is GDP
What Is GDP
What Is GDP
What Is GDP
What Is GDP
What Is GDP
What Is GDP
What Is GDP
What Is GDP
What Is GDP
What Is GDP
What Is GDP
What Is GDP
What Is GDP
What Is GDP
What Is GDP
What Is GDP
What Is GDP
What Is GDP
What Is GDP
What Is GDP
What Is GDP
What Is GDP
What Is GDP
What Is GDP
What Is GDP
What Is GDP
What Is GDP
What Is GDP
What Is GDP
What Is GDP
What Is GDP
What Is GDP
What Is GDP
What Is GDP
What Is GDP
What Is GDP
What Is GDP
What Is GDP
What Is GDP
What Is GDP
What Is GDP
What Is GDP

How we can work together

See Our Solutions

Next

Generation

Investing

©2020, Esoterica Capital LLC (“ESOTERICA”). All content is original and has been researched and produced by ESOTERICA unless otherwise stated. No part of ESOTERICA’s original content may be reproduced in any form, or referred to in any other publication, without the express written permission of ESOTERICA. The content is for informational and educational purposes only and should not be construed as investment advice or an offer or solicitation in respect to any products or services for any persons who are prohibited from receiving such information under the laws applicable to their place of citizenship, domicile or residence.


Certain of the statements contained on this website may be statements of future expectations and other forward-looking statements that are based on ESOTERICA's current views and assumptions, and involve known and unknown risks and uncertainties that could cause actual results, performance or events to differ materially from those expressed or implied in such statements. All content is subject to change without notice. All statements made regarding companies or securities or other financial information on this site or any sites relating to ESOTERICA are strictly beliefs and points of view held by ESOTERICA or the third party making such statement and are not endorsements by ESOTERICA of any company or security or recommendations by ESOTERICA to buy, sell or hold any security. The content presented does not constitute investment advice, should not be used as the basis for any investment decision, and does not purport to provide any legal, tax or accounting advice. Please remember that there are inherent risks involved with investing in the markets, and your investments may be worth more or less than your initial investment upon redemption. There is no guarantee that ESOTERICA's objectives will be achieved. Further, there is no assurance that any strategies, methods, sectors, or any investment programs herein were or will prove to be profitable, or that any investment recommendations or decisions we make in the future will be profitable for any investor or client. Professional money management is not suitable for all investors. For full disclosures, please go to our Terms & Conditions page.