Monthly Investor Letter, October 2022

“New beginnings are often disguised as painful endings.”

-- Lao Tzu

The Rolling Correction of Semiconductors?

It was well understood that the consumer electronics market, including PC and smartphones, had been weak over the past few quarters as the strong demand during the peak COVID period proved unsustainable. As macro uncertainty picks up and demand weakens, hardware OEMs are becoming increasingly cautious about the future and not replenishing inventories, creating a typical inventory down cycle in these markets. Semiconductor companies in the PC & smartphone supply chain expect their Q4 revenue to be 20% below prior expectations across the board. AMD saw its PC-related revenue cut by half as it tried to correct the inventory situation as quickly as possible by meaningfully under ship the end demand.

This kind of inventory correction is common after periods of strong demand, but it is much more severe this time due to the supply-demand imbalance over the past two years. It usually takes a few quarters to work through the inventory in the channel. When the end demand stabilizes, customers rebuild inventory, and the cycle starts again. These inventory corrections create much volatility in the markets and are short-term in nature. They also often mark the bottoms for the stocks as the bar gets reset lower.

However, the worry is that with a looming recession, it is just a matter of time before things break down in other markets that are further away from consumers (Datacenter, automotive), creating this “rolling correction of semiconductor” narrative. It seems that demand in those markets is holding up much better, at least for now, according to the companies reported recently. Still, we do not doubt that sentiment could turn negative swiftly with just a few negative comments. We don’t think there is a definitive answer, and we can’t prove this theory one way or another. But we believe these are fundamentally better markets with stronger growth, longer product cycles, higher margins, and stickier customers. If such inventory correction happens, it’s likely to create a good opportunity for long-term gain.

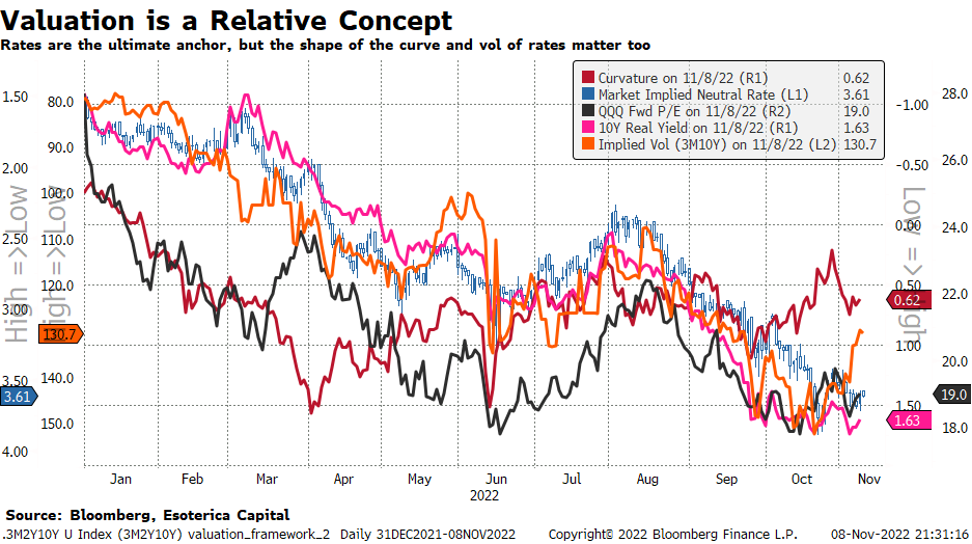
Understanding Market Through Valuation Framework

By and large, equity valuation is anchored to interest rates. For example, the 10Y real yield is the return of risk-free assets after adjusting for inflation. When the real yield falls, equity valuation goes up, and vice versa (Chart 1). There are other driving factors, such as the curvature of the yield curve and the implied volatility of rates, as we discussed in previous monthly letters. They could determine the tightness of financial conditions, which subsequently affects the valuation of risky assets.

Chart 1

article
Valuation is a Relative Concept

Through this lens, we could make sense of the fluctuation of equity valuation in the past month. Coming into October, stronger-than-expected inflation data and labor market print, plus the continued hawkish tone from the Fed and chaos out of UK markets, have put much pressure on rates and the implied volatility of rates. These forces together brought down the valuation. However, the valuation held up relatively better, given that these driving factors were much worse than previous lows in June. The curvature of the yield curve, indicating an easier monetary policy stance, gave much-needed support to equities (Chart 1).

When the narrative of a slower pace of hiking rates due to concerns over financial stability and recessions gained more momentum, the curvature and the implied volatility started to lift the valuation, despite the rates remaining suspicious. This dynamic remained largely the same even after a dovish FOMC statement but a hawkish press in early November. Rates implied a tighter monetary policy stance than that indicated by the curvature and the implied volatility. As a result, the equity valuation got stuck in between.

Looking forward, in the absence of another significant inflation shock, we might stay in this “gridlock” before the Fed finally pivots. It’s a data-dependent process, as these driving factors will likely fluctuate within the range depending on the incoming inflation print. In other words, the equity’s valuation might have found the bottom, but the Fed’s “higher for longer” also caps the upside until data proves otherwise.

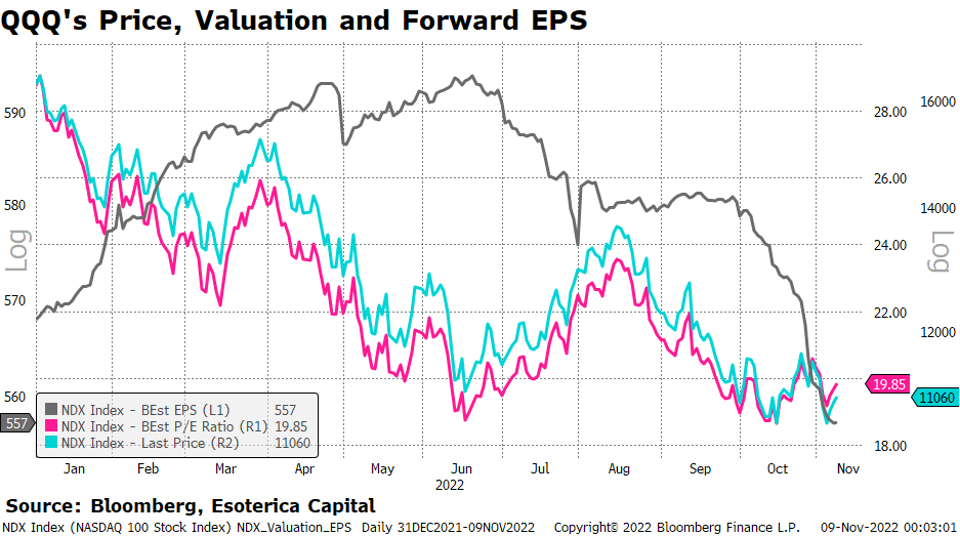
“Higher for Longer” Is Earning’s Problem

Last month we voiced our concern that the Fed’s higher-than-usual tolerance for deteriorating fundamentals could impose more downside risk on equities. The negative EPS revisions could hit investors before the Fed pivots. Unfortunately, this has happened during this earnings season (Chart 2). The companies, ranging from large-cap high-quality FAANG stocks to smaller and already beaten-down SaaS companies, all gave gloomy guidance without much exception, citing the challenging macro environment in the coming quarters. As a result, the stocks got hit by disappointing earnings without much support from valuations.

Chart 2

article
QQQ's Price, Valuation and Forward EPS

Worse, this situation could last as long as the Fed is convinced that “higher for longer” is the right policy stance. Although we tend to believe that the Fed underestimates how tight its monetary policy has been, the damage could be done before the Fed realizes it. The companies’ durable and resilient earnings in the coming quarters offer the best risk management in this environment. That’s where we should spend the most time on.

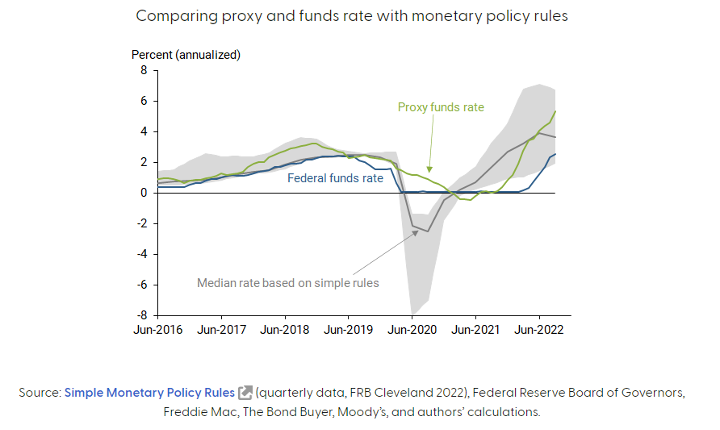
How Tight Is the Fed?

We have been challenging the notion that the Fed’s monetary policy is not tight enough to put down inflations. On the contrary, after being too soft on inflation in the first half of 2021, the Fed caught up quickly (here and here) since the fourth quarter of 2021. What’s frustrating but also understandable is that monetary policies work with quite significant lags. It just takes time, and the Fed probably needs to be patient. Over-killing might cause unnecessary damage.

Therefore, it’s encouraging to see that the Fed seems to acknowledge the issue now. In a recently published paper, “Monetary Policy Stance Is Tighter than Federal Funds Rate,” the researchers at the Fed concluded,

“Since late 2021, monetary policy has been substantially tighter than the federal funds rate indicates. Tightening financial conditions are similar to what would be expected if the funds rate had exceeded 5.25% by September 2022.”

We borrow the chart to show how tight the Fed is based on its research (Chart 3) and recommend this paper to our readers.

Chart 3

article
Comparing proxy and funds rate with monetary policy rules

LETTERS

Esoterica's statements are not an endorsement of any company or a recommendation to buy, sell or hold any security. For full disclosures, click here.

Get the most lucid takes on where things are headed

Articles and educational writing for smarter investing.

How to Build a Three-Fund Portfolio

Asset Allocation for Diversification

How to Measure Economic Cycles

What Is GDP
What Is GDP
What Is GDP
What Is GDP
What Is GDP
What Is GDP
What Is GDP
What Is GDP
What Is GDP
What Is GDP
What Is GDP
What Is GDP
What Is GDP
What Is GDP
What Is GDP
What Is GDP
What Is GDP
What Is GDP
What Is GDP
What Is GDP
What Is GDP
What Is GDP
What Is GDP
What Is GDP
What Is GDP
What Is GDP
What Is GDP
What Is GDP
What Is GDP
What Is GDP
What Is GDP
What Is GDP
What Is GDP
What Is GDP
What Is GDP
What Is GDP
What Is GDP
What Is GDP
What Is GDP
What Is GDP
What Is GDP
What Is GDP
What Is GDP
What Is GDP
What Is GDP
What Is GDP
What Is GDP
What Is GDP
What Is GDP
What Is GDP

How we can work together

See Our Solutions

Next

Generation

Investing

©2020, Esoterica Capital LLC (“ESOTERICA”). All content is original and has been researched and produced by ESOTERICA unless otherwise stated. No part of ESOTERICA’s original content may be reproduced in any form, or referred to in any other publication, without the express written permission of ESOTERICA. The content is for informational and educational purposes only and should not be construed as investment advice or an offer or solicitation in respect to any products or services for any persons who are prohibited from receiving such information under the laws applicable to their place of citizenship, domicile or residence.


Certain of the statements contained on this website may be statements of future expectations and other forward-looking statements that are based on ESOTERICA's current views and assumptions, and involve known and unknown risks and uncertainties that could cause actual results, performance or events to differ materially from those expressed or implied in such statements. All content is subject to change without notice. All statements made regarding companies or securities or other financial information on this site or any sites relating to ESOTERICA are strictly beliefs and points of view held by ESOTERICA or the third party making such statement and are not endorsements by ESOTERICA of any company or security or recommendations by ESOTERICA to buy, sell or hold any security. The content presented does not constitute investment advice, should not be used as the basis for any investment decision, and does not purport to provide any legal, tax or accounting advice. Please remember that there are inherent risks involved with investing in the markets, and your investments may be worth more or less than your initial investment upon redemption. There is no guarantee that ESOTERICA's objectives will be achieved. Further, there is no assurance that any strategies, methods, sectors, or any investment programs herein were or will prove to be profitable, or that any investment recommendations or decisions we make in the future will be profitable for any investor or client. Professional money management is not suitable for all investors. For full disclosures, please go to our Terms & Conditions page.