Monthly Investor Letter, March 2022

“There are decades where nothing happens, and there are weeks where decades happen.” -- Vladimir Ilyich Lenin

March 2022 will go down in history as one of those times. The Russia-Ukraine war has profoundly changed the geopolitical landscape, and sitting on the sidelines seems no longer an option for superpowers. The soaring commodities prices turned an already uncomfortable inflation outlook into a scary one. The Fed carried on its hawkish stance, igniting an intense selling-off in the rates market and ultimately the inversion of yield curves. Not to mention the unprecedented ups-and-downs of Chinese equities provoked by growth concerns, delisting fears, and a timely pro-market "policy put" by Vice-Premier Liu He. You would have expected risky assets to fare poorly. Well, not so fast. QQQ finished the month on a solid footing (4.67%), despite an intra-month 8.25% drawdown followed by a head-scratching rally. Welcome to investing.


A Front-Loaded Catching Up

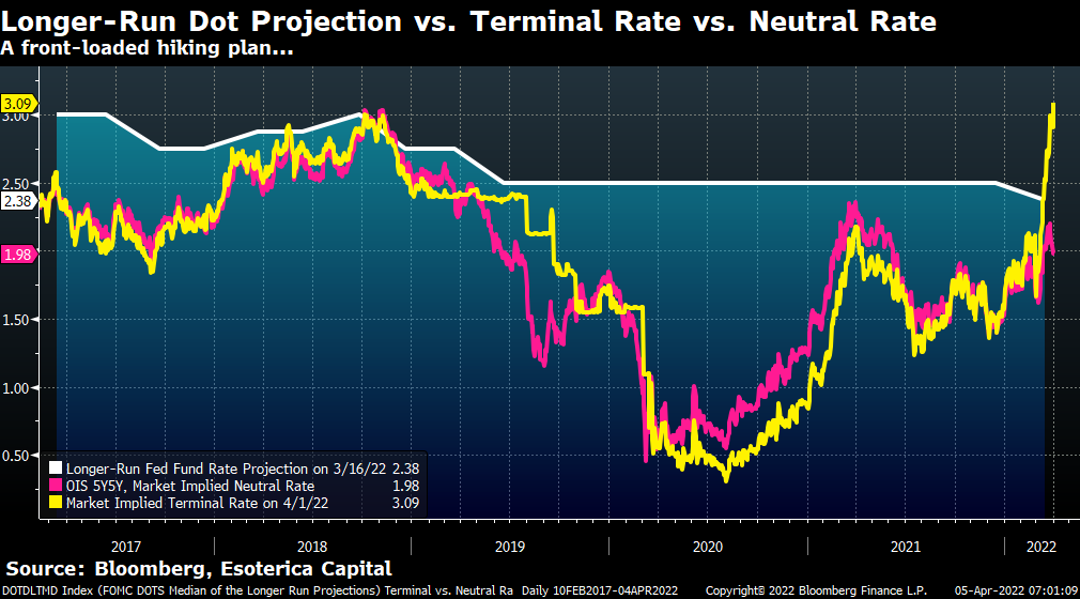
We expected the Fed to execute on its "whatever it takes" pledge to put out the fire, and in the FOMC March meeting, they delivered in a front-loaded fashion. The Fed signaled to raise the terminal rate (the highest level of fed funds rate in the cycle) above the neutral rate (the rate at which monetary policy is neither restrictive nor accommodative) to cap the roaring inflation expectations. The market well received the message: the market-implied terminal rate (MSTERM Index, Chart 1) has quickly priced in the Fed's policy tweak and sharply gone beyond the market-implied neutral rate (OIS 5Y5Y rate, Chart 1).

Chart 1

article
Longer-Run Dot Projection vs. Terminal Rate vs. Neutral Rate

The Fed's lowering of the longer-run fed funds rate projection (Fed-implied neutral rate, Chart 1) is an underappreciated policy move, intending to project the Fed's confidence in not letting the inflation out of control. We believe it helped calm down the nerve of the equity market and spurred the rally. The Fed officials tried extremely hard to depict a 1994-like soft-landing narrative, and the equity market hasn’t given up on that hope yet.

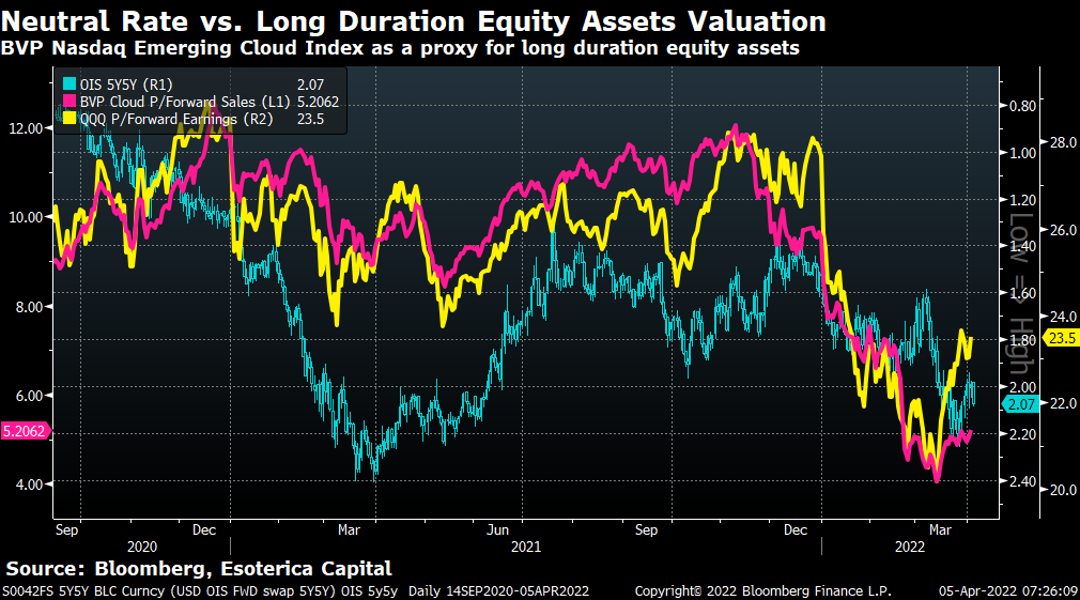
The large-cap, high-quality growth equities (QQQ as a proxy) have demonstrated much better convexity in this short-term rally (Chart 2). The valuation of QQQ has recovered quite a bit more than BVP Nasdaq Emerging Cloud Index as the Fed's lower longer-run dot anchored the market-implied neutral rate (inverted, Chart 2). With a maturing cycle and low visibility into inflation outlook, the large-cap, high-quality growth equities offer relatively better risk/reward trad-offs.

Chart 2

article
Neutral Rate vs. Long Duration Equity Assets Valuation

No Longer Behind the Curve

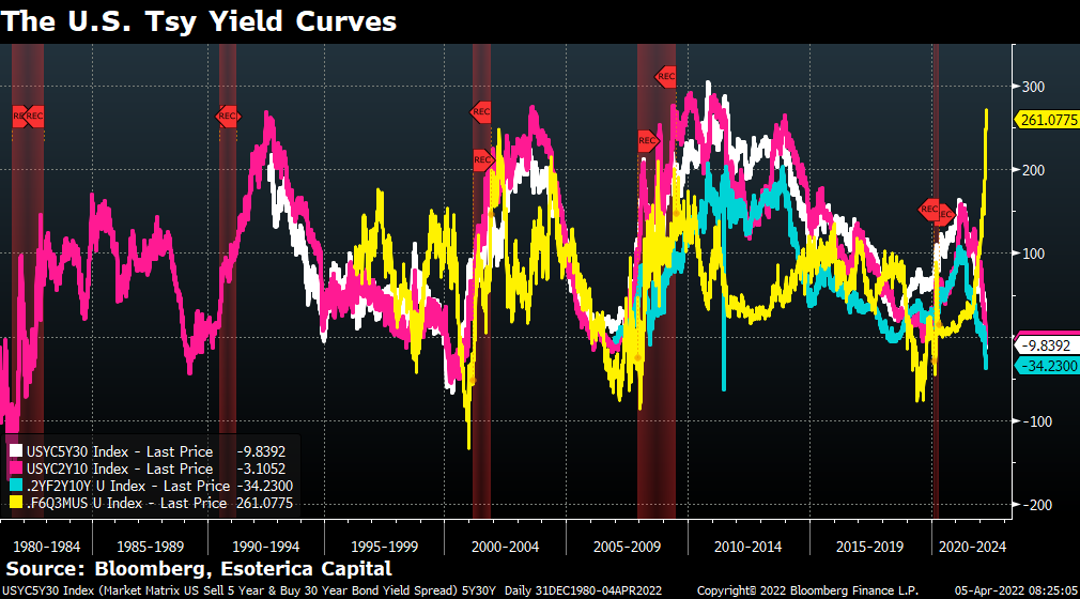
The yield curve inversion (Chart 3) dominates the market headlines as the curve spread has been a reliable indicator for predicting economic recessions. The inversion mainly happens at the long end of the curve, such as the spread between the 10-year and 2-year yield or the spread between the 30-year and 5-year yield, etc. The rates market is worried that the hawkish Fed will inevitably shove the economic growth off a cliff: soft-landing sounds too good to be true.

On the other hand, the Fed offers an alternative yield curve measure, the near-term forward yield spread (yellow line, Chart 3), which they believe is a better indicator for the near-term trajectory of monetary policy rates; therefore, the Fed’s policy stance. It's essentially the slope of the front end of the yield curve (such as the spread between the 2-year and 3-month rate). This alternative yield curve measure has been steepening in recent months, at significant odds with the conventional ones. The contradicting messages from different parts of the curve confused investors who rely on yield curves to gauge the market cycle.

Chart 3

article
The U.S. Tsy Yield Curves

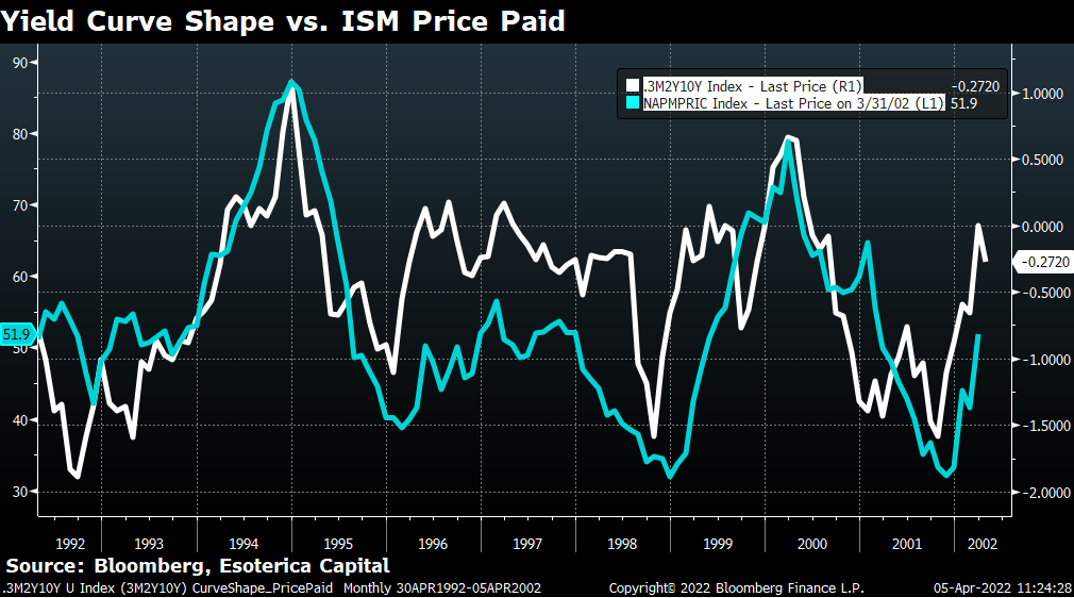
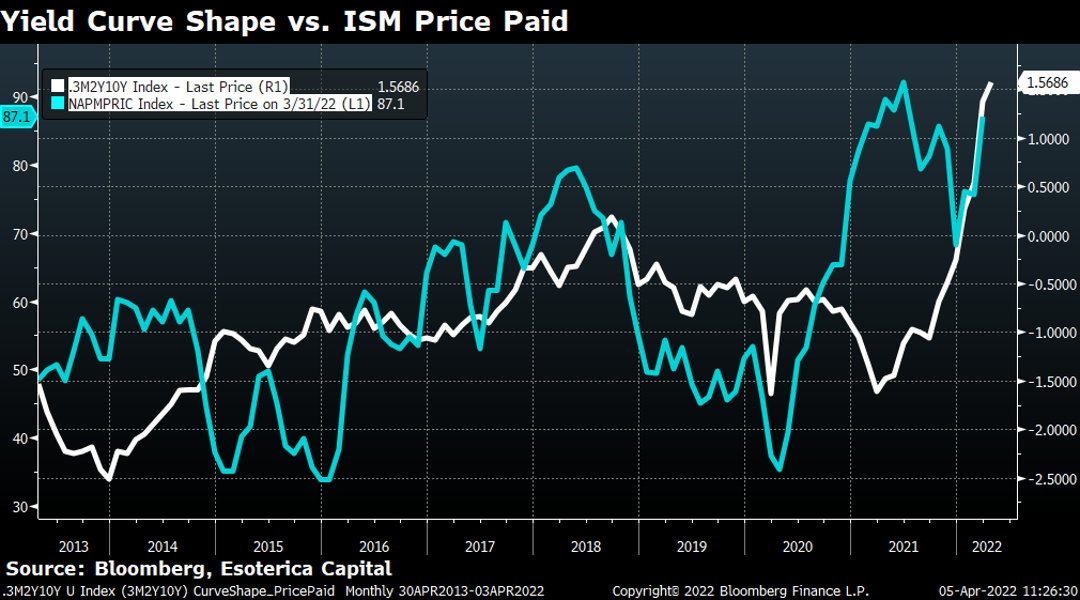
Instead of pondering the implications of yield curve slopes, we found the curvature of the yield curve (3M2Y10Y butterfly as a proxy) has been very informative regarding whether the Fed has been keeping up with inflation expectations.

Chart 4

article
Yield Curve Shape vs. ISM Price Paid (1992 to 2002)

Chart 5

article
Yield Curve Shape vs. ISM Price Paid (2013 to 2022)

Take the decade from 1992 to 2002, for example (Chart 4); the curvature of the yield curve had been consistent with the inflation expectation (ISM Manufacturing Price Paid as a proxy), indicating the Fed had been spot-on. That probably contributed to a rare but successful soft landing. In the past decade, the Fed was not noticeably behind the inflation curve until 2021 (Chart 5). However, the Fed has caught up quickly and doesn't seem behind the curve anymore by the same measure.

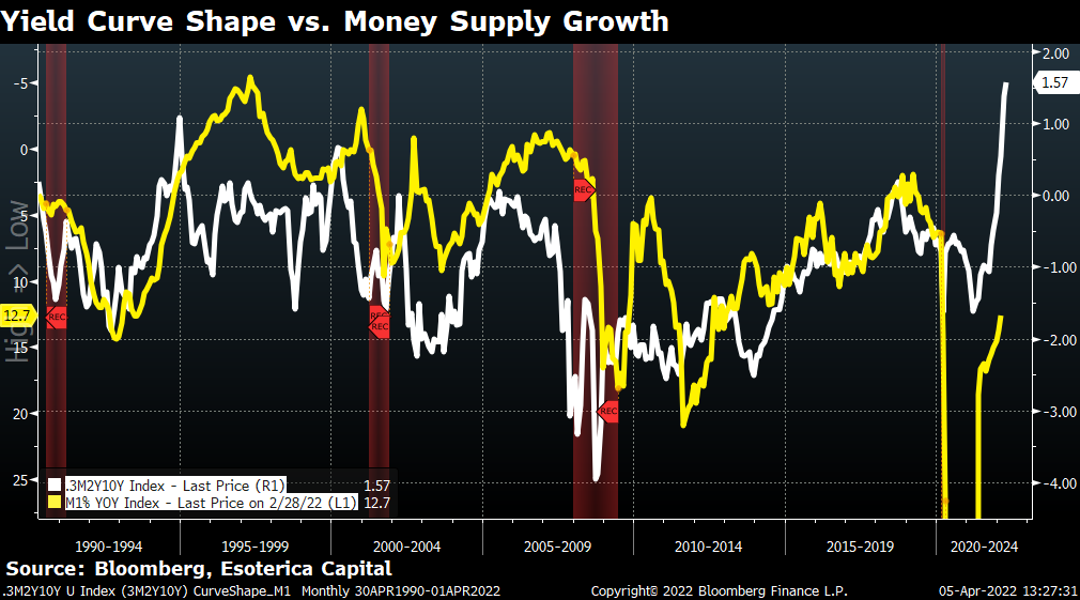
The flipside of a humped yield curve (as the one we currently have) is the decrease in the financial system's liquidity (M1 growth as a proxy, inverted, Chart 6). The Fed has publicly acknowledged this notion: tightening financial conditions is necessary to bring inflation back in line. As such, the pressure on risky assets remains intact. Don’t fight the Fed.

Chart 6

article
Yield Curve Shape vs. Money Supply Growth

Software: Setting the Stage

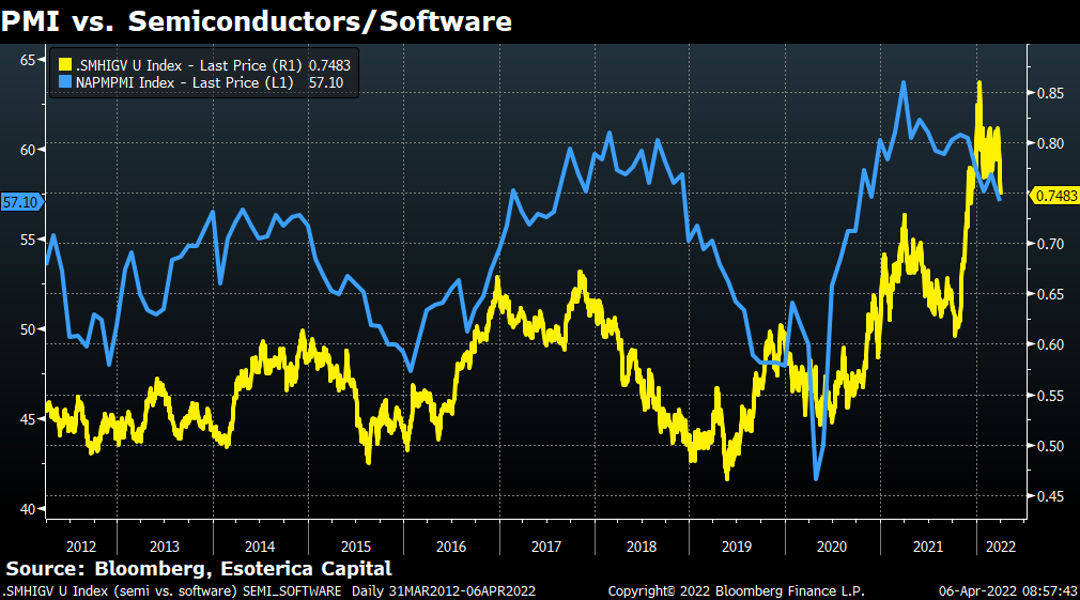
The latest ISM PMI indicated a slowing but not contracting U.S. economy (Chart 7). If history is any guide, growth investors are bound to rotate out of semiconductors for their inherent cyclicality and into software for the durability of growth. We like the current set-up of software and watch a few trends and risks as follows,

  1. Stable software spending. Morgan Stanley's latest CIO survey shows that software continues to be the fastest-growing sector within IT budgets (4.8% of growth in Q1'22 vs. 5.0% in Q4'21). We favor the investment thesis for network security as CIOs invest in return-to-work and on-premise infrastructure. The recent Okta incident and the Russia/Ukraine war highlighted the importance of cyber-security. Cloud computing will continue to dominate as CIOs re-architect multi-cloud environments and migrate to the cloud. Spend intention for data analytics and data cloud stays strong despite macro headwinds. The growth outlook of the software sector remains robust for 2022, but the margin profile is where investors need to focus.

  2. Exposure to Europe. FX headwinds and exposure to Europe/Russia represent the biggest risk to software earnings. We started to see macro uncertainty tampered with growth for companies with significant deal exposure to the region. UiPath, for example, was negatively impacted by $15M due to Russia exposure and $20M due to FX. As we head into the Q2 earnings season, investors need to be wary of uncertainties imposed by these macro risks.

Chart 7

article
PMI vs. Semiconductors/Software

LETTERS
FINANCIAL MARKETS
SEMICONDUCTORS
SAAS

Esoterica's statements are not an endorsement of any company or a recommendation to buy, sell or hold any security. For full disclosures, click here.

Get the most lucid takes on where things are headed

Articles and educational writing for smarter investing.

How to Build a Three-Fund Portfolio

Asset Allocation for Diversification

How to Measure Economic Cycles

What Is GDP
What Is GDP
What Is GDP
What Is GDP
What Is GDP
What Is GDP
What Is GDP
What Is GDP
What Is GDP
What Is GDP
What Is GDP
What Is GDP
What Is GDP
What Is GDP
What Is GDP
What Is GDP
What Is GDP
What Is GDP
What Is GDP
What Is GDP
What Is GDP
What Is GDP
What Is GDP
What Is GDP
What Is GDP
What Is GDP
What Is GDP
What Is GDP
What Is GDP
What Is GDP
What Is GDP
What Is GDP
What Is GDP
What Is GDP
What Is GDP
What Is GDP
What Is GDP
What Is GDP
What Is GDP
What Is GDP
What Is GDP
What Is GDP
What Is GDP
What Is GDP
What Is GDP
What Is GDP
What Is GDP
What Is GDP
What Is GDP
What Is GDP

How we can work together

See Our Solutions

Next

Generation

Investing

©2020, Esoterica Capital LLC (“ESOTERICA”). All content is original and has been researched and produced by ESOTERICA unless otherwise stated. No part of ESOTERICA’s original content may be reproduced in any form, or referred to in any other publication, without the express written permission of ESOTERICA. The content is for informational and educational purposes only and should not be construed as investment advice or an offer or solicitation in respect to any products or services for any persons who are prohibited from receiving such information under the laws applicable to their place of citizenship, domicile or residence.


Certain of the statements contained on this website may be statements of future expectations and other forward-looking statements that are based on ESOTERICA's current views and assumptions, and involve known and unknown risks and uncertainties that could cause actual results, performance or events to differ materially from those expressed or implied in such statements. All content is subject to change without notice. All statements made regarding companies or securities or other financial information on this site or any sites relating to ESOTERICA are strictly beliefs and points of view held by ESOTERICA or the third party making such statement and are not endorsements by ESOTERICA of any company or security or recommendations by ESOTERICA to buy, sell or hold any security. The content presented does not constitute investment advice, should not be used as the basis for any investment decision, and does not purport to provide any legal, tax or accounting advice. Please remember that there are inherent risks involved with investing in the markets, and your investments may be worth more or less than your initial investment upon redemption. There is no guarantee that ESOTERICA's objectives will be achieved. Further, there is no assurance that any strategies, methods, sectors, or any investment programs herein were or will prove to be profitable, or that any investment recommendations or decisions we make in the future will be profitable for any investor or client. Professional money management is not suitable for all investors. For full disclosures, please go to our Terms & Conditions page.